Trend is nothing but direction of movement. Logically the share price can either be rising or falling or moving narrowly (flat)
It's also an aspect of technical analysis that tries to predict the future movement of a stock based on past data. Trend analysis is based on the idea that what has happened in the past gives traders an idea of what will happen in the future.
Trend analysis tries to predict a trend like a bull market run and ride that trend until data suggests a trend reversal (e.g. bull to bear market). Trend analysis is helpful because moving with trends, and not against them, will lead to profit for an investor.
Thus there are three direction in which price can move. When price move upward the trend is "rising". When the price move downwards the trend is "falling" And when the price are moving in a narrow range the trend can be called as "Choppy or Flat"

Price line do not rise or fall straight. It is generally interrupted by a counter move. This counter move is known as a reaction. If the scrip is rising, the counter move would be against the rise. If the scrip is falling, the counter move would be against the fall. Because of these counter moves, the scrip can be said to be moving in a zig-zag fashion, which gives rise to tops and bottoms.
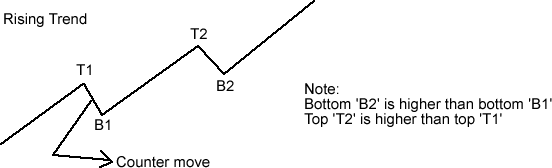
Rising Trend
In a rising trend one would find the zig zag price movement carrying the scrip upwards. In this, the scrip will exhibit the formation of higher bottoms and higher tops.
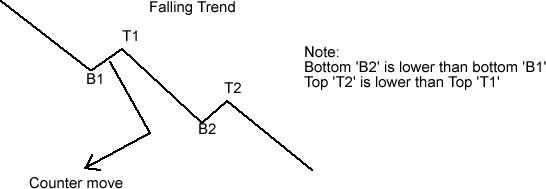
Falling Trend
During a falling trend, the zig zag movement would carry the price downwards so the scrip would form of lower tops and lower bottoms.
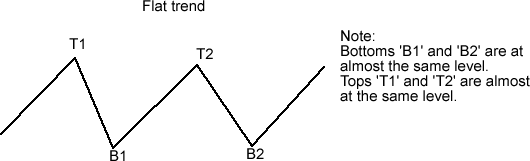
Flat trend or Choppy Trend
During sideways or flat trend, the zig-zag movement would carry the prices sideways and the scrip would neither form clear cut higher bottoms and higher tops nor form of clear cut lower tops and lower bottoms.
Always the trader or the investor has three options - to buy, sell or stay away from market. If the trend is rising, he would do well to buy. If the trend is falling, he should be selling, and if the trend is flat, it is best to move away from the market. This is because in a flat trend, the scrip would neither be rising nor falling, and hence the trader/investor would lose out on the interest or the opportunity cost of funds apart from being frustrated of course.
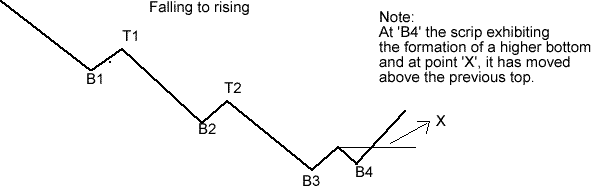
Reversal of Trend's
These trends will not last for ever. If the scrip is rising (rising trend), it is possible that it may start to move narrowly or fall after some time. Again, if the scrip is moving narrowly, it may start to rise or fall sooner or later. A falling scrip cannot go on falling. At some point, it will start moving flat or upwards. Thus, it can be seen that the trend at any given point of time is vulnerable to change. This change in the direction of trend is referred to as trend reversal.
The position of the bottoms and tops that determines the trend at any given point of time. Hence, if a rising scrip want to start falling, it must start forming lower tops and lower bottoms. So to identify when a rising trend will reverse to a fall trend, we has to observe the tops and bottoms and the moment the script forming lower top and lower bottom, one can say the trend has reversed directions and has become bearish or is falling.

In short, trend Analysis helps you capitalize on directions in which the stock price is moving based on pure supply and demand. The main advantage here is that, you dont worry about the fundamentals behind the stock. Because we assume all fundamentals ,sentiment, and economy factors are reflected on the price of the stock always and the Trend will show the directions in which Stock will be heading in the immediate future. And is a perfect tool for short term traders.